Below is a detailed breakdown of the May 2026 BDO Business Performance Index survey results.
Business performance sentiment at a glance
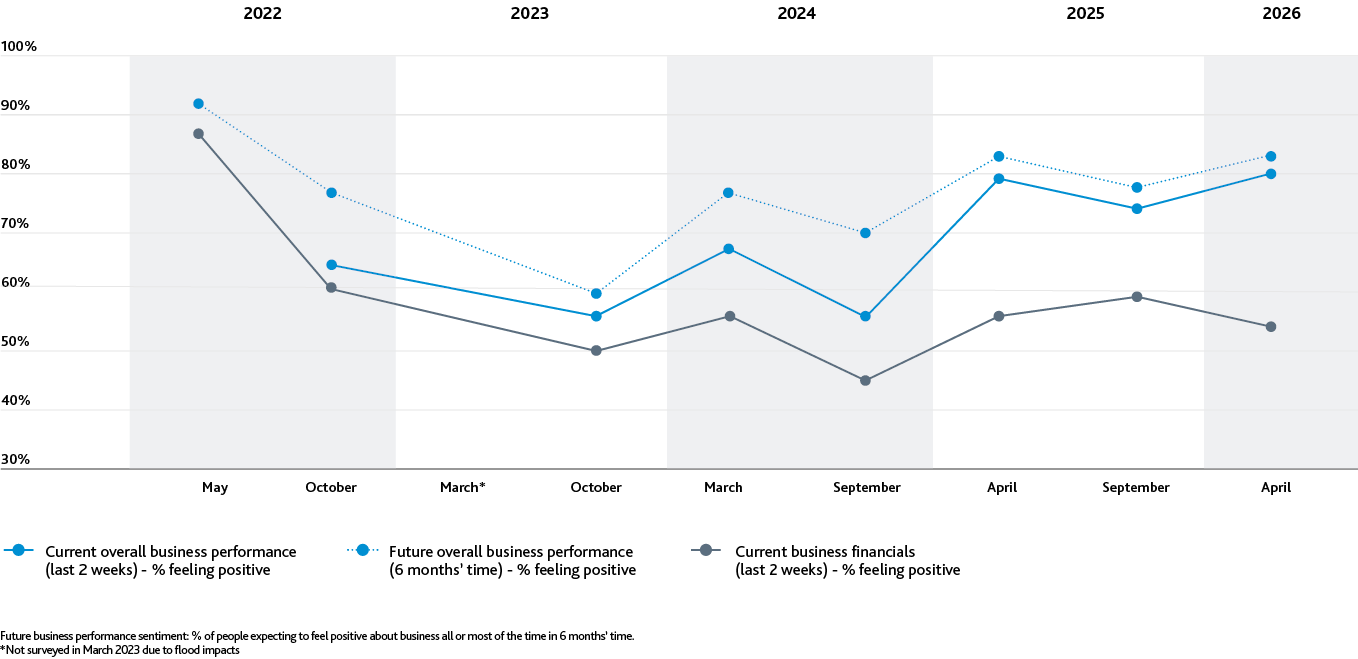
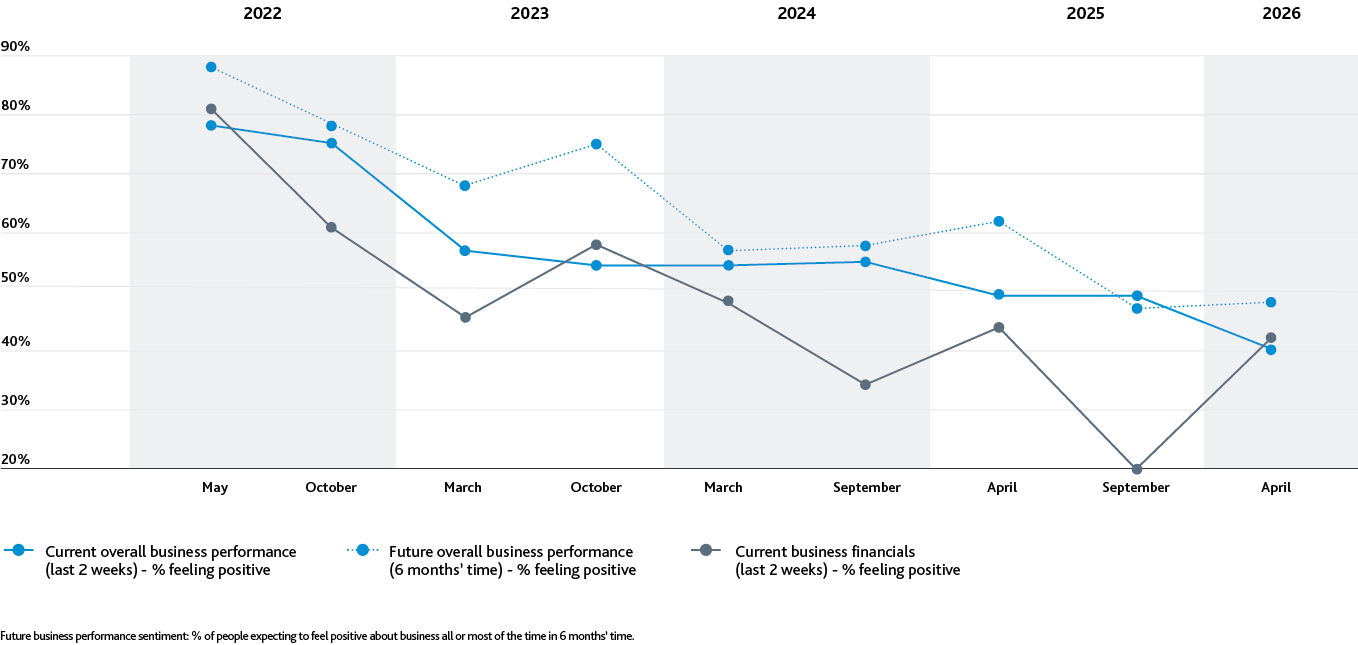
Business performance sentiment: Trend
% Business leaders feeling positive (all or most of the time)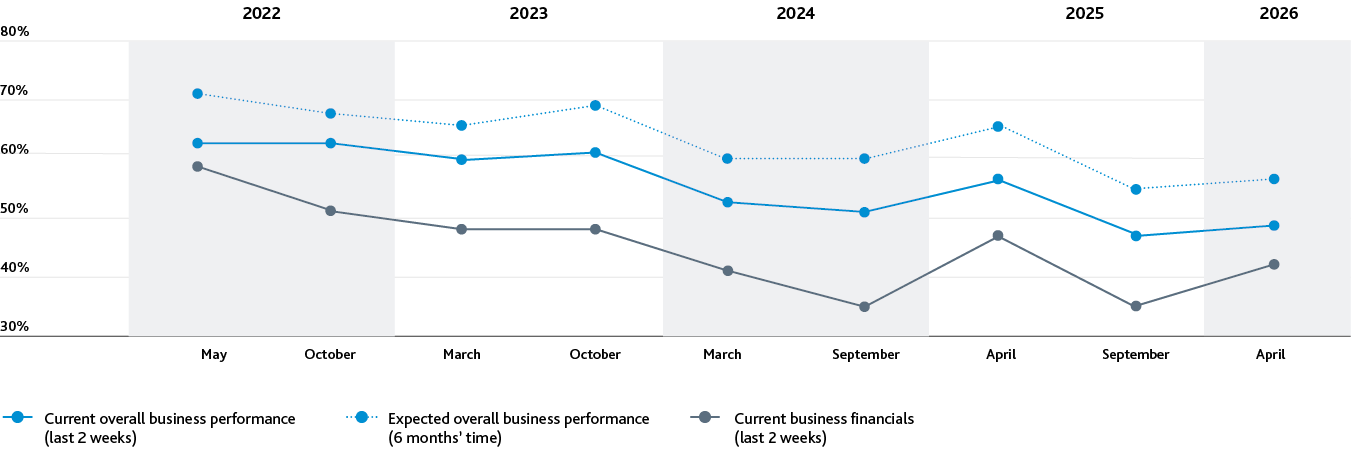
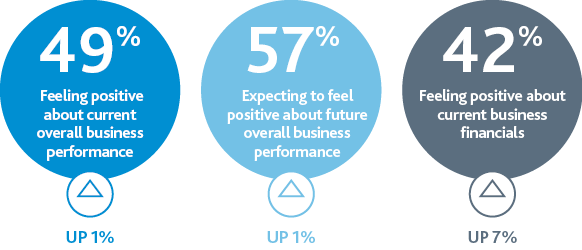
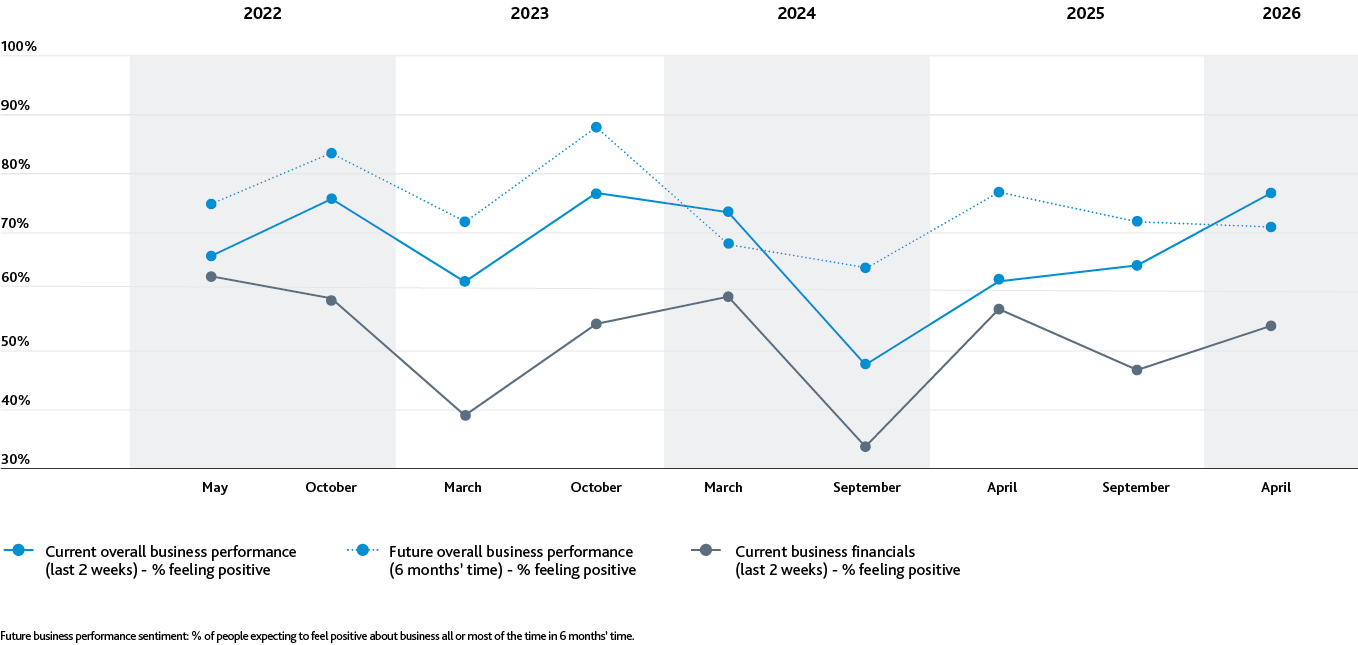
Business performance sentiment: Current vs future
% Feeling positive in last 2 weeks* vs % expecting to feel positive in 6 months’ time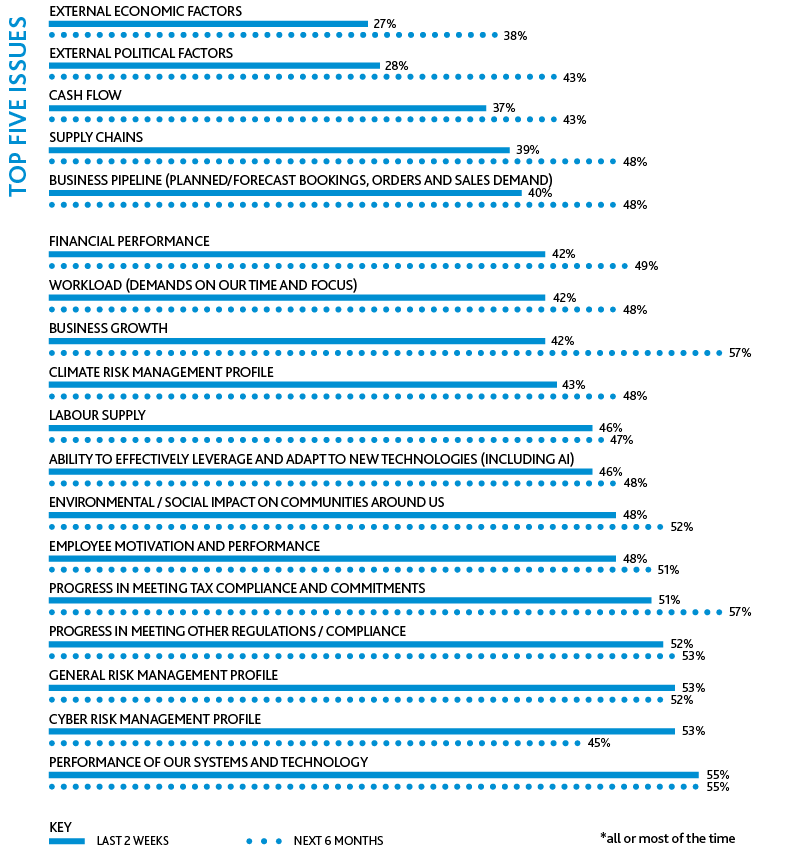
% Feeling positive about overall business performance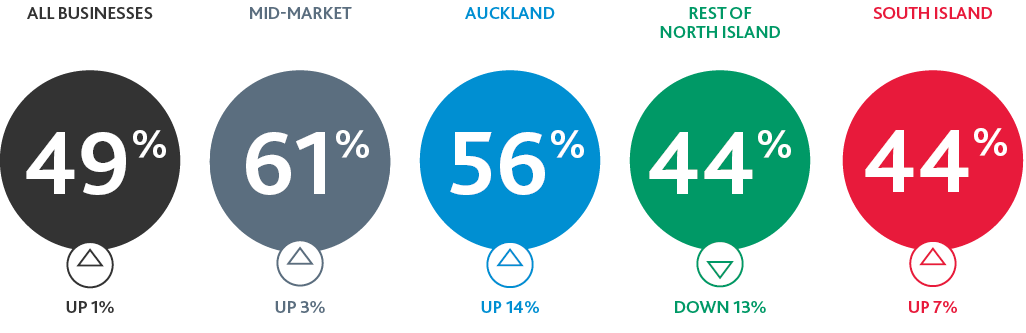
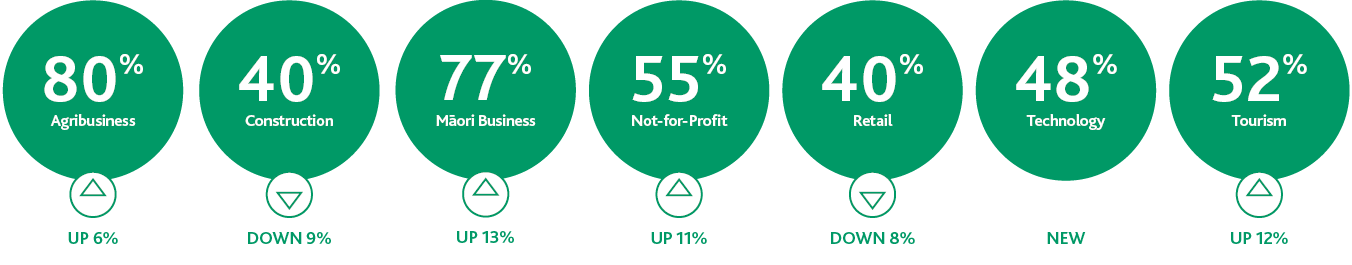
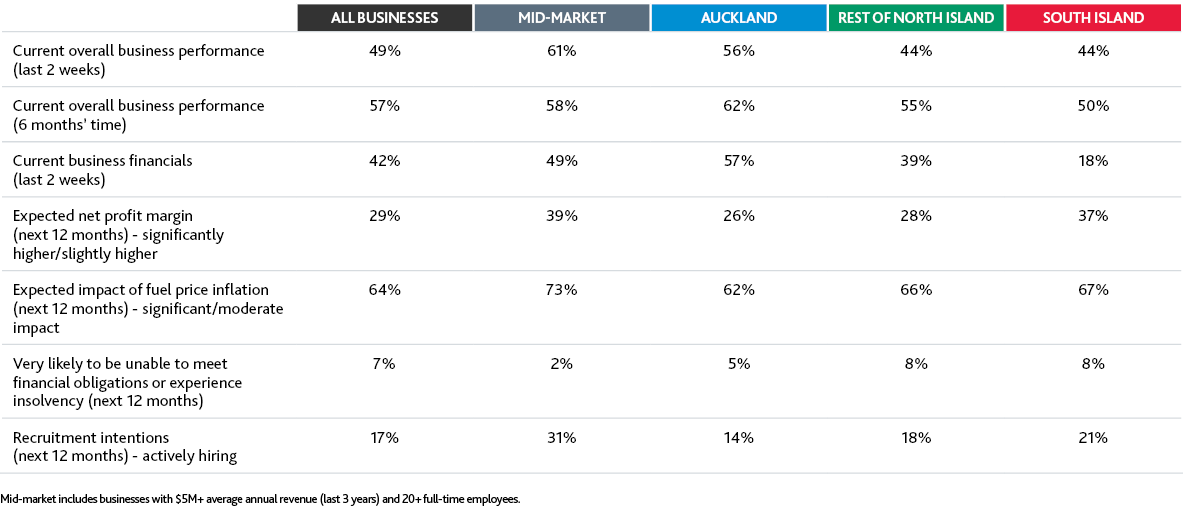
Sector business performance sentiment at a glance
% Business leaders feeling positive in last 2 weeks (all or most of the time)
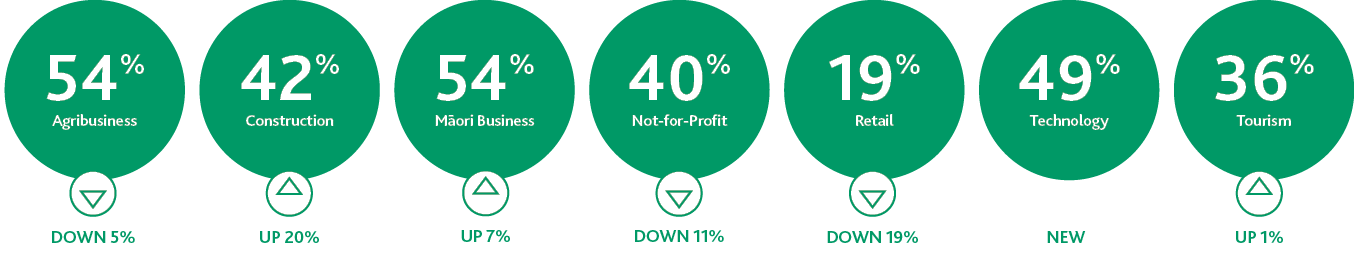
Current business financials per sector
% Business leaders feeling positive (all or most of the time) in the past 2 weeks.
Agribusiness performance sentiment: Trend
% Business leaders feeling positive in last 2 weeks (all or most of the time)
Construction performance sentiment: Trend
% Business leaders feeling positive in last 2 weeks (all or most of the time)
Māori business performance sentiment: Trend
% Business leaders feeling positive in last 2 weeks (all or most of the time)
Retail business performance sentiment: Trend
% Business leaders feeling positive in last 2 weeks (all or most of the time)
Tourism performance sentiment: Trend
% Business leaders feeling positive in last 2 weeks (all or most of the time)
Business performance sentiment
% Business leaders feeling positive (all or most of the time)
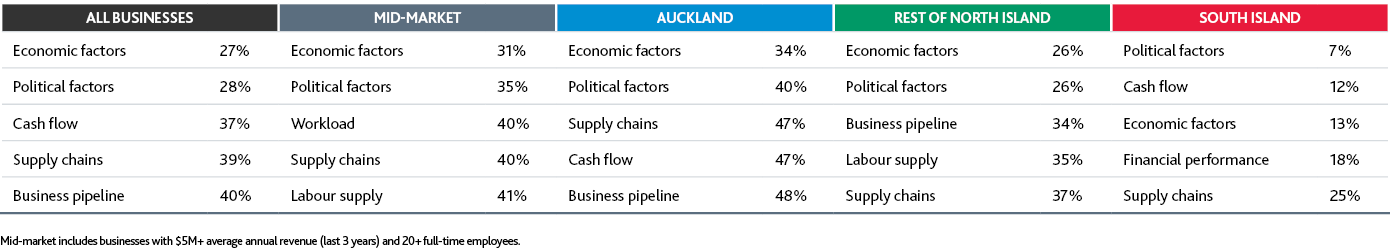
Top five issues: Business performance
Lowest scoring business performance attributes. % Business leaders feeling positive (all or most of the time) in last 2 weeks
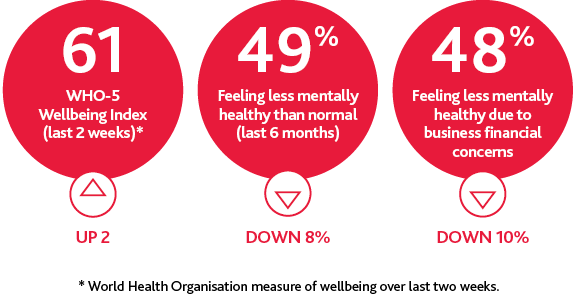
Business leader wellbeing at a glance
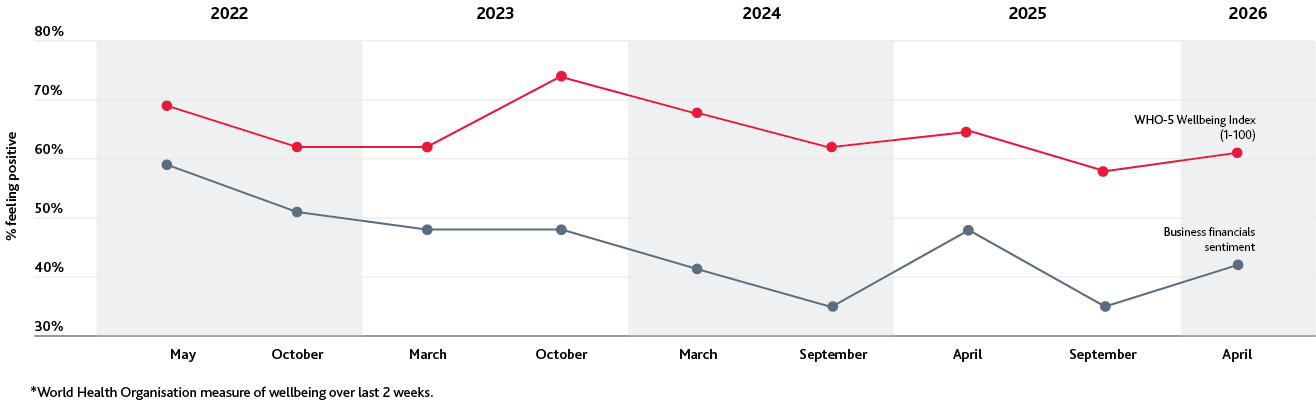
Business financial sentiment and wellbeing follow a similar trend
% Feeling positive about business financials in last 2 weeks (all or most of the time) vs WHO-5 Wellbeing Index*
Business leader wellbeing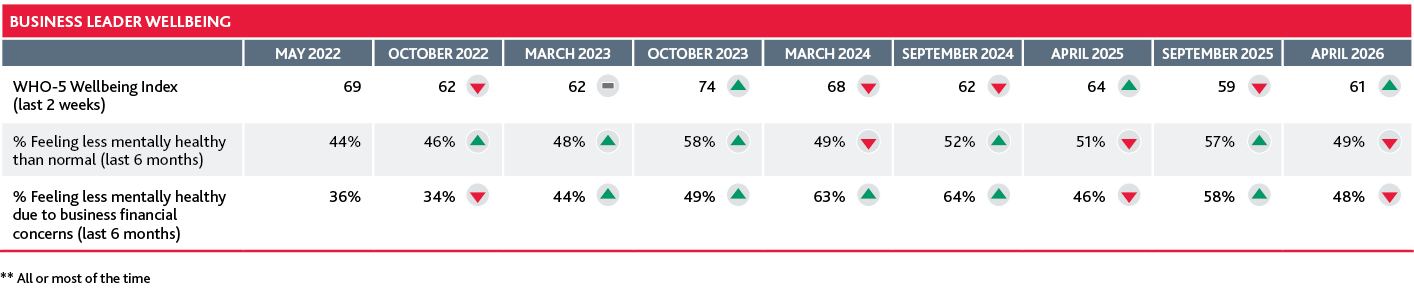
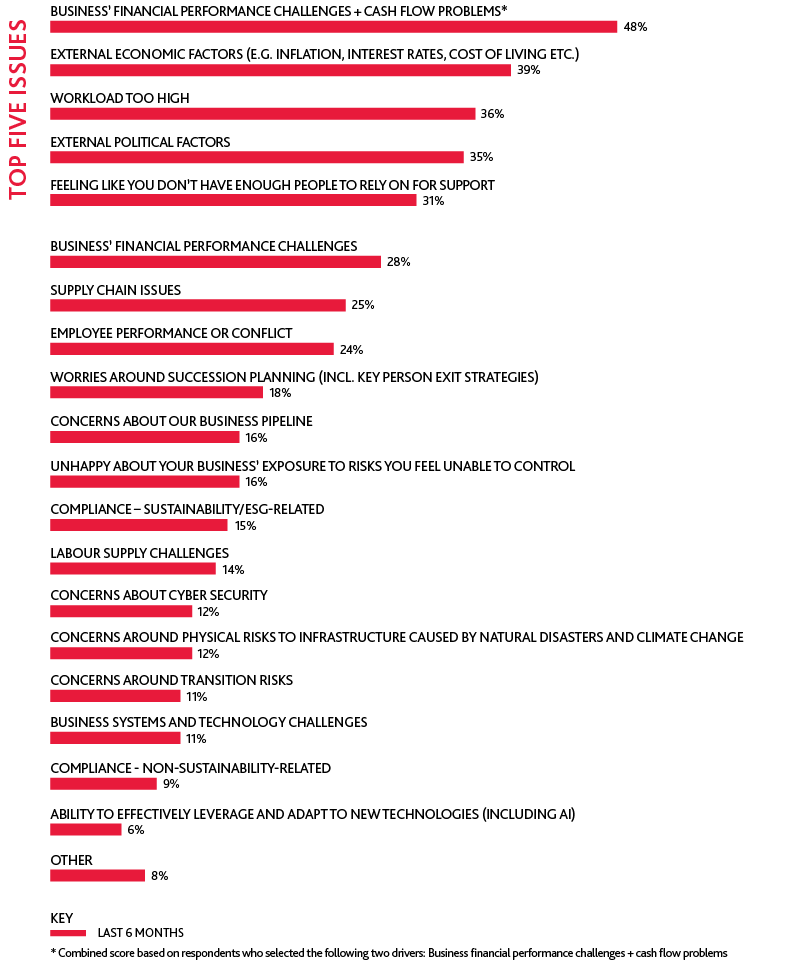
Top five drivers of negative wellbeing over time
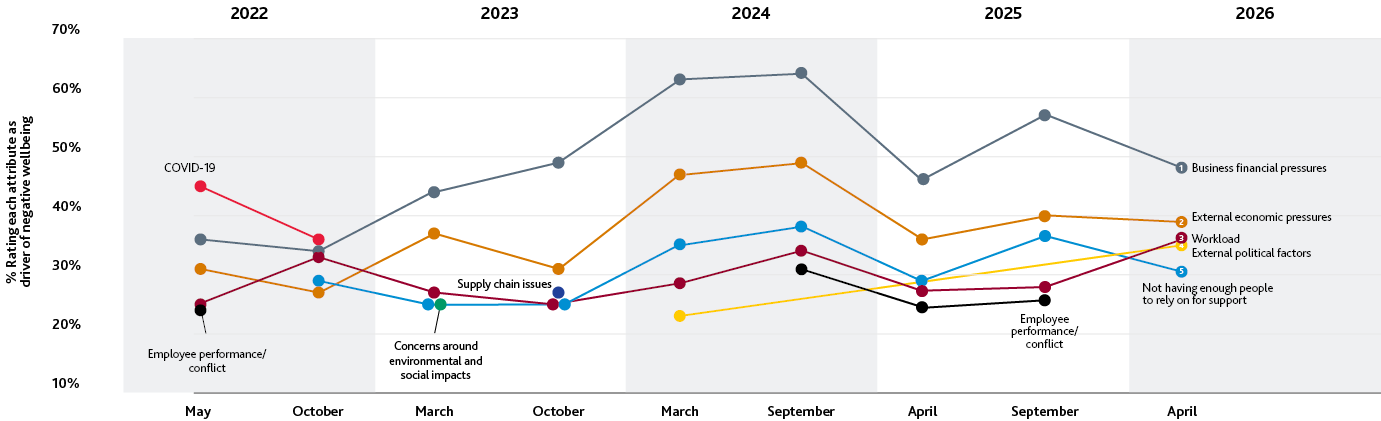
Drivers causing business leaders to feel less mentally healthy than normal